A PROTOTYPE OF DETACHED BOUNDARY LAYER FLOW
The flow over a smooth shallow wall mounted bump has been introduced by Marquillie and Ehrenstein (2003) as a prototype for an highly unstable flow displaying both a rich spectrum at vortex shedding frequencies and also a low frequency peak sometimes called flapping. These features are linked to the extremely elongated recirculation region and the associated long and thin shear layer.

Figure 1: Boundary layer flow over a wall-mounted bump and typical frequency spectra at Re=600 (adapted from Marquillie and Ehrenstein 2003)
Once the tools for global linear instability of 2D open flows have been developed around 2005, it has become possible, thanks to highly accurate spectral collocation discretization methods, to computed both nonlinear unstable solutions of the steady Navier-Stokes equations as well as the dominant eigenvalues governing their dynamics. As shown in figure 2, several modes ressembling each other bifurcate almost simultaneously. They further share equidistant frequencies, which allow them to beat together. We tentatively suggest that the low frequency flapping observed in detached flow simulations and experiments could be related to this generalized beating mechanism.
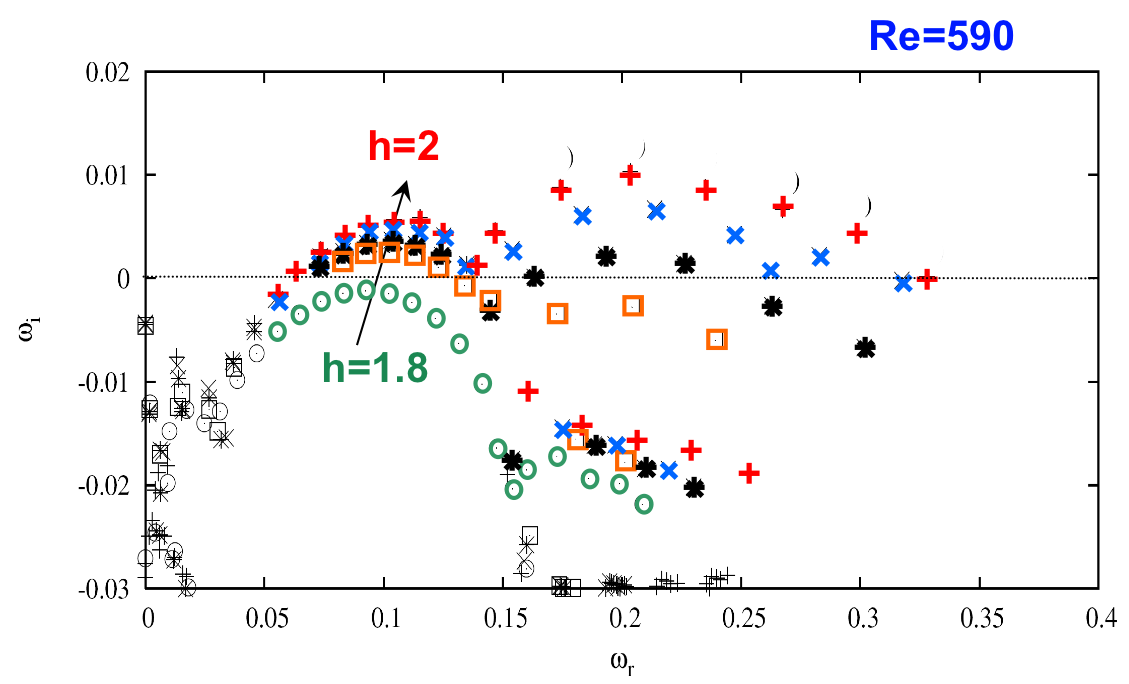
Figure 2 : Dominant eigenvalues at Re=590 for several bump heights h (measured in boundary layer thicknesses) [adapted from Ehrenstein and Gallaire 2008].
A HIGHLY SENSITIVE EXPERIMENT
In order to establish the reality of this scenario, E. Boujo (PhD student at LFMI funded by FNS), has designed a boundary layer wind tunnel experiment including a wall-mounted bump that can be operated at Re=600 for typical incoming velocities of 1m/s.
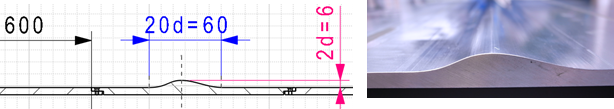
Figure 3 : Experiment ran at LFMI to study the instability of the detached flows.
PIV measurements have revealed that the real flow becomes non stationnary for Reynolds number much lower than expected by the computations. As a consequence the mean recirculation length reverses its trend (figure 4) at Re=350 instead of Re=600.
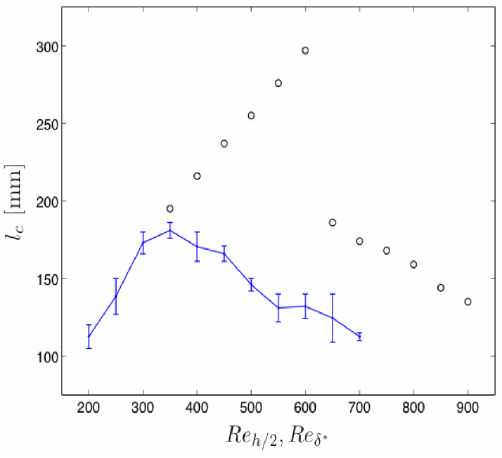
Figure 4 : Comparison between the experimentally obtained mean recirculation lengths (in blue) and the numerical ones (in circles). The transition is seen to occur for much lower Reynolds number in the experiment than predicted.
We suspect that this could originate either from 3-D effects that are absent in the numerical computations or from a large receptivity to incoming noise. Although the latter has been minimized to 0.3% turbulence level, the present detached boundary layer flow has however an extraordinary amplifying potential, even for values of Re well in the stable range, as shown in figure 5 were the optimal frequency response is represented for values of Re ranging from Re=250 to 600.
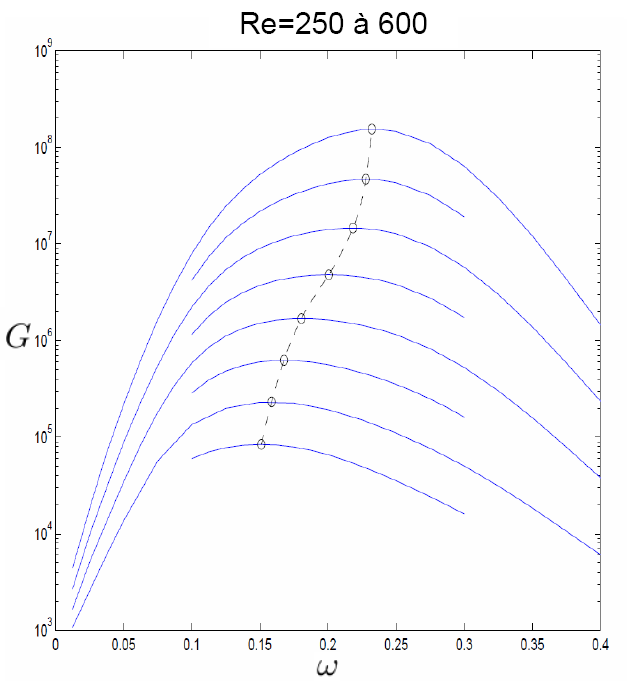
Figure 5 : Optimal energy amplification of an harmonic forcing.
OPEN-LOOP CONTROL
Open-loop control strategies can be defined and optimized by considering sensitivity maps. A typical sensitivity map of G(ω=0.23) at Re=500 is hown in figure 6. This map, computed by an adjoint method, represents in color scale the variation (or sensitivity) of the maximal energy amplification G(ω=0.23) when the flow is modified by a unit forcing located at a given location.
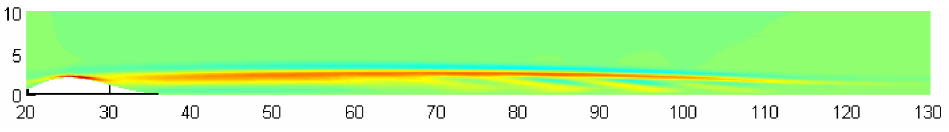
Figure 6 : Sensitivity map of the optimal energy amplification of an harmonic forcing at ω=0.23
An important limitation of the present control strategy, which has been optimized for a specific value of the harmonic forcing frequency, is related to its robustness and how the receptivity to other frequencies will be also influenced.